Showing posts with label economics. Show all posts

Friday, 21 November 2008

What's With This Financial Crisis?

George Soros has written an interesting piece regarding the global financial crisis, the first section of which provides a nice, tight overview of what has happened. He goes on to argue that the prevailing economic theories of financial markets have been wrong for quite some time, before proposing the framework for a new premise on which to build the theory.
I am woefully under-qualified to critique his proposal, but it seems to be relatively sound and to take a much more moderate position than previous theory has.

He attacks market fundamentalism quite strongly as faulty, suggesting that the fundamentalists were deluding themselves. He points out something that has seemed so obvious to me from even a precursory understanding of economics that I have long been dismayed and bewildered that so many otherwise rational economists don't seem to grasp its broad strokes - "Just because regulations and all other forms of governmental interventions have proven to be faulty, it does not follow that markets are perfect."
Indeed it doesn't take much to see that markets are often imperfect. Many, if not most, of the economics courses we can study during our degrees are centred around one form of market failure or another.

Admittedly, governments are rather poor at getting things done.
They're far worse at getting things done well.

In a similar vein to the concerns Soros voices at the end of his piece, I worry that our governments will use this as a rationalisation to impose their own faulty, emotion-blinded ideological approaches to economic management. Though to much to hope for in anything but the most idealistic of fantasies, it would be nice to see a government that acts on the basis of solid data and research rather than the ideological views of its constituent lobbies, special interest groups, and political hacks.

Thursday, 23 October 2008

Can Price Incentives Improve Hybrid Car Markets?

The following is a mock consultancy report prepared by myself and a fellow class-mate as part of the Resource & Environmental Economics III course. The mock report was prepared for (the imaginary version of) the South Australian Department of Treasury and Finance as An Examination of a Government of South Australia Incentive Scheme for Hybrid Electric Vehicles.

This report was written by myself and Christian Reynolds.


Executive Summary

This report has been commissioned by the South Australian Department of Treasury and Finance to examine the effects of implementing an incentive scheme to reduce the price of petrol-electric hybrid vehicles within the South Australia. This report will examine this policy issue, discuss relevant theory and research, the effects of such a policy, various management options, alternatives to the policy, and provide a final recommendation.

The report finds that whilst a price incentive will improve HEV demand, difficulties with increasing supply limit the effectiveness of the incentive. Furthermore, it is likely that alternative strategies can provide a more efficient outcome. Thus this report does not recommend the implementation of such a policy.

Introduction

South Australians are increasingly concerned about the environment in general and about climate change in particular. A February 2008 poll conducted by Newspoll found that 57% of South Australians believe that the environment is a very important issue (Newspoll, 2008). In July 2008, 84% of Australians believed that climate change is currently occurring (Newspoll, 2008). Greenhouse gas (GHG) emissions (specifically carbon dioxide, CO2) have become the focus of substantial controversy, with those that are produced by human activities (most notably the burning of fossil fuels) having increased the concentrations of GHG in the atmosphere far beyond the levels historically experienced – an increase of more than 40% since the beginning of the industrial age (SA 2007 strategic plan. T3.5, p23). The South Australian Government has pledged in its 2007 strategic plan to

“…achieve the Kyoto target by limiting the state’s greenhouse gas emissions to 108% of 1990 levels during 2008-2012, as a first step towards reducing emissions by 60% (to 40% of 1990 levels) by 2050.” (Government of South Australia 2007)

Transportation is a major source of greenhouse gas emissions. Even excluding emissions arising from electricity generation for public transport (such as electric trams and trains) or from fuel sold to international ships or aircraft, transport accounts for approximately 14% of Australia’s total greenhouse gas emissions (Garnaut, 2008). Transport is currently the third largest emitter of greenhouse gases in Australia (Transport SA (a) 2002), with over 45556 Gigagrams of direct CO2 equivalent being produced in 2004 by cars alone (Department of Climate Change 2008). As such a decrease in transport-related emissions must form a critical part of South Australia’s climate change response.

More extensive use of the public transport system has been suggested as a way of reducing GHG’s with 25% of the public transport fleet now Compressed Natural Gas (CNG) run buses(Transport SA (b) 2002). The next step to achieving this reduction in GHG’s could be the introduction of a price reduction for petrol-electric hybrid cars to enable the South Australian public to match the public transports systems uptake of GHG reducing technology.

One way that the state government believes it can reduce emissions is through increasing the number of hybrid electric vehicles (HEVs) being driven. A logical step in achieving the necessary reduction is the introduction of an incentive scheme that reduces the price of gas-electric hybrid vehicles. HEVs also reduce other negative externalities alongside GHGs including air and noise pollution and are more fuel efficient in the long term (Denniss 2003).

The transport industry is also beneficial to the South Australian economy with 118,000 cars produced in 2007 (about 35% of the Australian total), leading to over AU$1.5 billion worth of exports and over 9,500 local jobs (southaustralia.biz 2008). Due to a majority of the hybrid cards being manufactured overseas there must be some consideration given to the survival of local South Australian industry. The Victorian automotive industry has with the Victorian and Commonwealth Governments started ‘the Green Car Innovation Fund’, a scheme worth AU$500 million (Office of the Prime Minister 2008). This fund will operate over five years from 2011 and aims to help the Australian automotive industry develop and manufacture low-emission vehicles so as to meet the challenge of climate change whilst maintaining critical automotive industry jobs (Carr Kim 2008). The South Australian Government is not currently involved in this fund and no announcements towards becoming involved have been made. Though research and development of HEV-technology is a separate issue it is important to be aware that a majority of HEVs will be manufactured outside of South Australia and are likely to be imported from overseas.

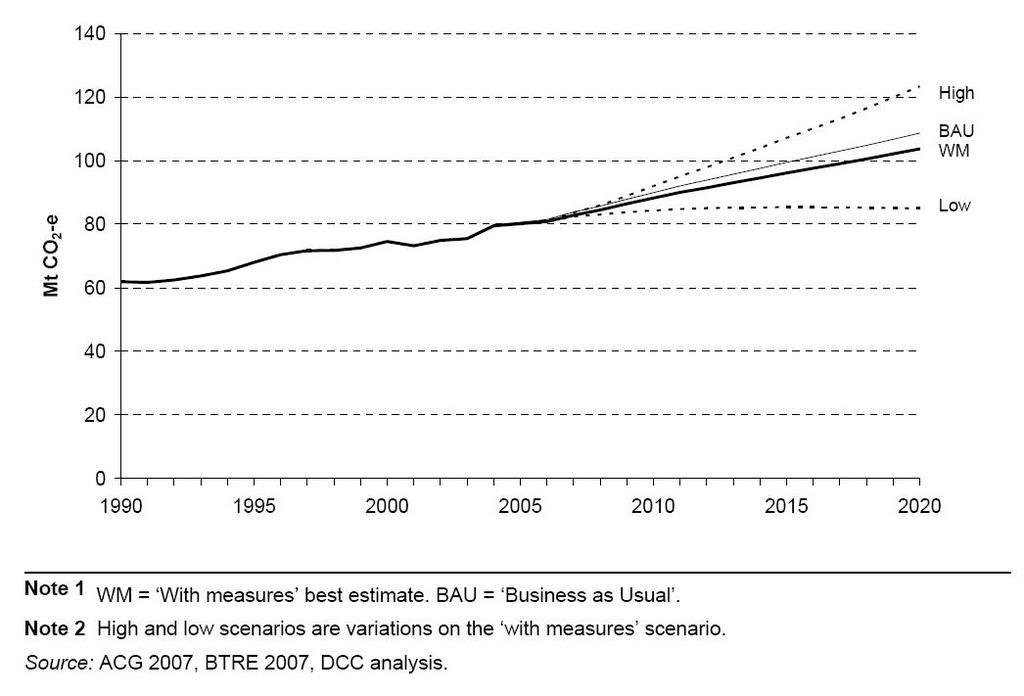
Population growth and economic growth are expected to have a major impact on the demand for transport in South Australia (and thus emissions levels). This can be seen in Figure 1 with the ‘high’ level beyond 2010 being well outside South Australian Government guidelines (WM) or even if everything else remains constant (BAU).

Figure 1 Greenhouse gas emissions for the Australian transport sector
Source: Department of Climate Change. TRANSPORT SECTOR GREENHOUSE GAS EMISSIONS PROJECTIONS 2007, 2008, p5


Theory and Research on Subsidies and Incentive Schemes:

Market forces will generate efficient outcomes only when market conditions include; the existence of perfect information, the absence of market power, the absence of externalities, and the availability of substitutes (Denniss 2003 2-3). The South Australian Government proposed incentive scheme aims to correct the market and reduce the impact of negative externalities – a cost associated with the production/consumption of a good or services which, has not been taken into account by either the producers or consumers - for example GHG and CO2 emissions (Rosen 2005 ch5).

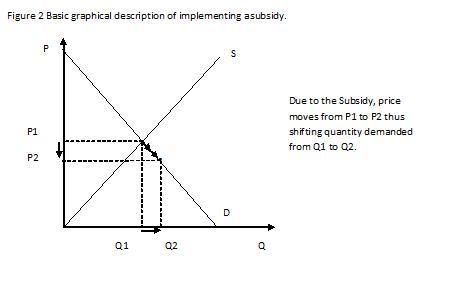
A subsidy is a form of financial assistance paid to a business or economic sector. In this specific case the subsidy in question will be a consumption subsidy given by the South Australian Government to reduce the price of HEVs such that they are more affordable to consumers and a greater quantity are sold. This theory is demonstrated in Figure 2. This assumes that the only barrier to buying a new car is the price and that there is sufficient supply to meet all new demand.

Subsidies are a direct way of achieving efficient results and previous studies (Perkins 1998) have shown that with public support they are ‘relatively successful at shifting demand’. It must be noted however that the subsidy must be large enough to create an effective incentive for consumers. Essentially, it must at least offset any price differential or perceived disadvantage of the subsidised good.

As HEVs face lower ongoing operating costs (due to lower fuel costs for the same use) (Dowling,2007) the incentive does not need to be as large as might be expected. This assumes that the consumer is both rational and long sighted. Gleisner (2006 84-85) gives the example of a NZ$7000 subsidy for the purchase of the hybrid Toyota Prius resulting in a cost differential of NZ$1270, in favour of Prius purchasers over a ten year period.

A difficulty with the basic model described above in this scenario is the unusual nature of the supply side. Many of the hybrid car manufactures make a loss producing HEV’s (Michaels 2001). Thus the quantity of these vehicles produced remains capped by the manufacturers. In the Australian market there are two dominant HEVs – the Honda Civic and the Toyota Prius. The cheaper of the two is the Honda Civic with a cap of 80 per month sold in the Australian market. The Toyota Prius is also under supply control with caps in place(Michaels 2001). Thus the question arises - will the subsidy have any effect beyond increasing demand? Michaels (2001) states that it may make production decrease further (or even stop) if a large subsidy was introduced on hybrid cars due to the fact that the more cars sold the more money is lost by the producers. Alternatively, the subsidy may allow manufacturers and suppliers to increase the price, thus decreasing their losses and increasing their willingness to supply.

A further problem with the proposed subsidy is that it does not affect behavioural patterns beyond encouraging the purchase of a more fuel efficient car. It will have no effect on how much, where and how the car is driven. This could result in more severe externalities if the consumers are not responsible drivers (through the consumers producing more emissions through longer drives, more noise and increased petrol consumption due to bad driving technique and habits) (Gleisner 2006 84-5).

Thus there is no guarantee that this subsidy will lower emissions. It is likely that an emissions reduction would occur however given the minuscule supply of HEVs, it is unlikely to be a significant reduction

Management Options for the Incentive Scheme

There are a number of variables to consider in the implementation of an incentive scheme for HEVs. United States governments have utilised a number of differing methods, ranging from free parking to Federal Government tax credits. The most effective government-sponsored incentives have been those related to income or sales tax credits (Gallagher and Muehlegger 2008).

Gallagher and Muehlegger (2008) found that sales tax incentives were more effective in increasing HEV sales than income tax credit. This is likely due to the delayed nature of the income tax credit, thereby requiring the consumer to have the rebate amount available prior to purchase. Whereas a sales tax credit may be readily applied at the point of purchase and thus effectively reduces the price of the HEV immediately.

Unfortunately, tax credits are not an immediately viable option within South Australia. As both income tax and the GST are administered by the Commonwealth Government, there is no direct avenue for South Australia to implement such a plan.

An alternative is to provide an after-purchase rebate which could be applied for by providing proof of purchase of a qualifying vehicle. A notable difference to this system is that a tax credit is limited in total cost to the government by the amount of tax that the consumer is actually paying, whereas the full amount of a rebate would be payable in all cases. Whilst this may cost the South Australian Government more (assuming equally sized rebates) it is likely that the effect of such a rebate would be greater than an income tax credit (though less than a sales tax credit). This is for two main reasons. Firstly, the dollar value of the rebate will be higher for those consumers who will be paying an amount of tax less than the full-value of the rebate. Secondly, a system such as this will be more readily understandable by consumers.

An alternative to providing an after-purchase rebate directly to consumers would be a contribution towards the purchase price of the vehicle which would be paid at the time of purchase directly to the supplier. This would effectively reduce the up-front price of the vehicle for the consumer, functioning (from an incentives viewpoint) much as a sales tax credit.

As well as considering how the price-incentive is to be applied, it is also necessary to consider the size and variability of the incentive. The United States Federal Government HEV incentive currently pays between US$650 and US$3150 dependent on the fuel economy and emissions for each model of vehicle.

If the purpose of the incentive is to promote the use of environmentally-friendly vehicles and reduce overall GHG emissions, then a structure whereby vehicles with lower emissions and superior fuel economy are more strongly supported would be ideal.

The exact dollar-value of the optimal incentive will be difficult to determine. To promote an efficient market it needs to capture the difference in the external effects of fuel economy and emissions from HEVs and non-hybrid vehicles. It is also important to consider the need to promote adoption of the new technology as the lack of support infrastructure and imperfect consumer information will negatively impact the adoption of HEV technology. The support infrastructure may include a lack of availability of spare parts and appropriately qualified mechanics to maintain the vehicles. Imperfect consumer information can lead consumers to be wary of the new technology and possibly distrust or refuse to utilise such technology.


Alternatives to the HEV Incentive Scheme

It is important to consider the primary goal of increasing HEV use.

We believe that the aim of the State Government is more related to decreasing the negative environmental effects of personal transport than to increase HEV sales or to speed the adoption of HEV technologies. As such, it is important to consider alternative mechanisms for achieving this goal.

The principle advantage of increasing the use of HEVs is the significant reduction in greenhouse gas emissions. HEVs do still produce GHG emissions and thus still force a negative externality upon society. It is counter-intuitive to reward an action that still produces a negative externality. We believe that it would be more efficient to internalise the cost of the environmental impacts of all vehicles in their operating costs. An obvious way to do this would be through the inclusion of petrol in the Federal Emissions Trading Scheme. This will still lead to a stronger incentive to switch to HEV-technology than currently exists as the increased cost of fuel would have a greater impact on non-hybrid vehicle operating costs than it would on HEV operating costs.

Another alternative would be to partially capture emission costs through vehicle registration fees. As emissions are largely dependent on distance travelled, and registrations costs are fixed by time, this will not be a perfect solution. However, ensuring that less environmentally friendly vehicles will face a higher registration cost now and into the future will provide further (potentially quite strong) incentive to switch towards HEV-technology. A superior option would be to link costs directly to the type and quantity of driving. In part this can be accomplished through increasing the fuel costs, but this fails to capture the differing emissions level of different cars burning the same quantity of fuel under the same conditions. A per-kilometre charge built in to registration fees would overcome this, but is not a practically viable option at this time.

It is important to consider the equity effects of non-rebate based schemes. Access to personal transport is essential in many parts of South Australia and increasing the costs associated with the majority of vehicles will have a disproportionately large impact on poorer groups. It is especially important to consider that older cars, such as those found in the second-hand market, are generally less environmentally-friendly. As such low socio-economic groups who rely predominantly on older cars will face an even greater increase in costs than the average consumer. This could have significant welfare implications and it would be necessary to examine counter-measures to this impact.

Denniss (2003) suggests other ways to reduce the emissions and other forms of transport related pollution that can be undertaken on the state level instead of a cash subsidy:

· Provide free parking to owners of vehicles with a low environmental impact.

· Tax fuel inefficient vehicles or Make petrol more expensive for fuel inefficient vehicles, thus changing the buying and driving behaviour of drivers.

· ‘Cap and trade’ for parking spaces introduced in the CBD and other congested areas.

· Abolish mobile billboards.

· Deregulate the taxi industry to lower prices and increase peak hour taxi numbers.

· Allow public transport authorities to sell a combined lottery-transport ticket, thereby increasing patronage and generating additional funds for investment in new public transport infrastructure.

· Subsidies public transport to a higher rate making it even more inexpensive thus increasing uptake.


Effects of the Incentive Scheme

There are three important effects of the incentive policy to consider:

· Increased usage of HEVs – Assuming that HEVs are replacing non-hybrid vehicles (as opposed to being used alongside), this will reduce total emissions. This may also assist in the adoption of HEV-technology, both through increasing research and development incentives for car-manufacturers and through providing advantages to those aspects of adoption dependent on network effects. This will be minimal in absolute terms due to the minuscule nature of the current HEV market and the lack of scope for short-term expansion of supply.

· Financial Costs to the South Australian Government – The State Government will face the full dollar-value cost of the incentive program. Though this may be offset by the decreased externalities associated with transport. This is likely to be a small amount given the miniscule size of the HEV market at present.

· Potential Impact on South Australian Car Manufacturers – Currently, no HEVs are manufactured within South Australia, whilst non-hybrid vehicle manufacture plays an important role in the local economy. A switch from the larger, less fuel efficient vehicles produced in South Australia, towards HEVs may have a significant impact on the local industry. However, given the relative sizes of the HEV and non-hybrid markets, even an unprecedentedly large increase in HEV sales would likely have minimal impact on the overall sales of non-hybrid vehicles in the short run. In the long run, vehicle manufacturers would have the time and opportunity to invest in HEV manufacturing technology.


Conclusion and Final Recommendation

An incentive scheme based on a rebate is only likely to lead to a small increase in HEV sales. Gallagher and Muehlegger (2008) found that tax incentives were associated with only 6% of US high-economy hybrid sales from 2000 to 2006.

The effect of petrol prices is likely to put further pressure on HEVs potentially resulting in more rebates being provided whilst not necessarily having a large effect. In the presence of other greenhouse management strategies – such as a national Emissions Trading Scheme (ETS) – it is likely that an incentive to switch towards HEVs will already exist in a far stronger form than a likely rebate could provide and without imposing a direct cost on the SA Government. From an economic theory standpoint, the main aim of an incentive scheme would be to remove the externality-driven price discrepancies. This would be more efficiently captured by including the emissions in the final lifetime price of the vehicle, likely by increasing the operating costs of those vehicles that are high emitters of greenhouse gases. Although one must consider the important equity issues that may arise through such a scheme.

One can argue that the need to promote a faster adoption of HEV technology and the supporting networks it requires (such as the presence of sufficient qualified mechanics) is a market failure best overcome through a price subsidy scheme.

If the goal is solely to reduce greenhouse emissions from the transport sector, then it is worth considering applying incentive-modifying policies to that sector as a whole rather than to select portions of the sector. This could be accomplished in a number of ways, including differential vehicle registration costs dependent on greenhouse emissions and fuel economy, or through capturing the full cost of greenhouse emissions in the cost of purchasing and maintaining a vehicle – for example, an ETS that incorporates fuel costs, or a carbon tax that is applied to fuels.

We would recommend that the South Australian Government exercise caution in the implementation of an incentive scheme for HEVs. It is likely that without significant improvements on the supply side, the subsidy would have minimal impact. Furthermore, the implementation of policies that internalise the cost of the GHG emissions are likely to increase the demand for HEV’s well beyond already insufficient supply capacities. It is our recommendation that the South Australian Government does not implement this policy but instead pursues the wide-spread internalisation of GHG emission sources not covered by the preposed federal emissions trading scheme whilst lobbying for and supporting a strong, effective and comprehensive federal ETS.
Reference List

Carr Kim(2008) Green Car Innovation Fund To Address Climate Change Challenge Ministers for Innovation, Industry, Science and Research Innovation Minister, Media Release, 13 May

Denniss R (2003) Implementing policies to increase the sustainability of transport in Australia, Proceedings of the WA: Beyond Oil conference (online)

Department of Climate Change. (2008)Transport sector greenhouse gas emissions projections 2007, Commonwealth of Australia

Dowling Josh(2007) Hybrid cars the go as fuel price rockets, The Sun-Herald, June 10,

Gallagher, Kelly Sims and Muehlegger, Erich (2008). Giving Green to Get Green: Incentives and Consumer Adoption of Hybrid Vehicle Technology. (online) http://ksgnotes1.harvard.edu/Research/wpaper.nsf/rwp/RWP08-009 [Last accessed 13/10/2008]

Garnaut, Ross (2008). The Garnaut Climate Change Review: Final Report. Cambridge University Press, Port Melbourne.

Gleisner B. B. Weaver S(2006). A. Cars, carbon, and Kyoto: evaluating an emission charge and other policy instruments as incentives for a transition to hybrid cars in New Zealand, Kōtuitui: New Zealand Journal of Social Sciences, Vol. 1: 81–89

Government of South Australia (2007) South Australia’s Strategic Plan 2007, Government of South Australia

Michaels Patrick J. (2001) Don't Subsidize My Car (online) May 21,

Newspoll (2008) 20/02/2008 – Importance and Best Party to Handle Major Issues, http://www.newspoll.com.au/image_uploads/0205%20Issues%2020-2-08.pdf [Last accessed on 13/10/2008]

Newspoll (2008) 29/07/2008 Climate Change, http://www.newspoll.com.au/image_uploads/0708%20Climate%20Change%2029-07-08.pdf [Last accessed on 13/10/2008]

O'Dwyer, Gerard,(2004) Emissions trade 'jobs threat'. Utility Week, 1/16 Vol. 21, Issue 3

Office of the Prime Minister(2008), , Joint Press Conference with Minister for Industry, Kim Carr and Premier of Victoria John Brumby, Interview, Toyota Motor Corporation, Altona, Melbourne, 01 July (online)<>

Rosen, Harvey S.(2005)Public finance (7th ed). Chicago, Irwin

southaustralia.biz,(2008) Investing in SA – Automotive (online)

Transport SA (a)(2002)What are Greenhouse Gases? (online) 16th August

Transport SA (b)(2002) Alternative Fuels (online)<> 16th August

Monday, 8 October 2007

Is Health Care A Place For Free Markets?

Below is an essay (and I use that term loosely, reports with headings do not an essay make) I recently wrote for Public Finance III. I present it here in a largely unedited format.

Apologies for any problems with the tables. I seem to be having some rather embarrassing difficulties coding them properly.

Edit: Looks like the tables work fine, just didn't display nicely in the preview. (Also, fixed an extra line break in Table 2).
Second Edit: Fixed the nbsp in Table 2.
Third Edit: Did the same thing for Table 1.
Fourth Edit: Added labels. Here's hoping that's all that needs updating.

Daniel O'Brien.

----


Health care provision is a complex and multifaceted subject with numerous different approaches to its provision. The role of the public and private sectors in financing and delivering health care differs greatly across nations and the impact these have on health outcomes are complicated to measure. Health care ranks in the top three expenditures in both GDP and tax spending in the majority of OECD nations. This government intervention is predicated on the argument that it can provide superior equity and efficiency to private markets.


I -Efficiency of Health Care

Besley and Gouveia state that ‘in an idealised economy, health insurance would be provided competitively. … The markets in which individuals purchased medical care would also be perfectly competitive. The resulting allocation of resources would be efficient’ (Besley and Gouveia, 1994). For perfect competition to be viable an insurance market needs to meet five conditions (Barr, 2004).

The first condition is that the probability of an individual needing treatment must be independent across all individuals. This is a reasonable assumption except during major epidemics. The second condition requires that the probability of an individual needing treatment be less than one. Though this condition is met for the great majority of illnesses, it is not met for significant categories, notably pre-existing chronic diseases and congenital illness. This leads to significant gaps in coverage in the private health care market. The third condition requires that the probability of an individual needing treatment be known or estimable. Though this is generally true, difficulties arise with policies that provide long-term benefits such total permanent disability cover. (Barr, 2004)

More substantial difficulties are found with the fourth and fifth conditions. The fourth requires that there be no significant adverse selection problems. Adverse selection is prevalent within health care insurance. As premiums rise, those who are less likely to need treatment will purchase less insurance. Thus the likelihood of treatment being required within the insured population will increase and the insurance company will be required to make a greater proportion of payouts, this will put further upwards pressure on the premium and lead to further adverse selection problems. This results in significant difficulties in acquiring insurance in high risk groups, notably the elderly population. (Barr, 2004)
The fifth condition requires that there be no significant moral hazard problems. Moral hazard is a major problem within many health care insurance markets and arises in three ways. Individuals with health insurance may be less likely to take precautions with their health. More substantially, some health care is choice-driven, notably pregnancy and doctor-consultations for seemingly minor conditions. This leads to either an increase in the consumption of health care or to gaps in coverage. The most substantial moral hazard issue is the third-party payment problem. This arises as a result of the arrangement of agents within the health care insurance market. Effectively, the primary cost-bearing agent, the insurance company, is divorced from the decision making of the doctor and the patient and thus has little direct impact on the level of consumption. Furthermore, neither the doctor nor the patient face the full social cost of health care and will thus over-consume. In the extreme case, where insurance companies cover all costs, the doctor and patient face zero private costs and will consume all health care that provides a positive private benefit, resulting in serious over-consumption. (Barr, 2004)
This can be further exacerbated where the doctor is paid on a fee-for-service basis and thus will have a positive private benefit for all health care consumption.

The failure to meet these conditions causes the health care market to fail to operate in a perfectly competitive manner and thus there is an inefficient allocation of health care goods. Government intervention, through public financing or delivery, may be useful to provide a more efficient allocation.


II - Equity of Health Care

Barr discusses two concepts of equity within health care. The first is that of horizontal equity, which calls for perfect information and equal power. Both of these are often absent within health care.

Patients face great difficulties in assessing their health care needs. Medical knowledge is very technical. Patients are generally ignorant as to the quantity of health care that they need and the quality that they are receiving. They are ignorant of various treatment options and of likely outcomes. Even previous personal experience in consuming health care is rarely of assistance, as many medical services are only used once in a life-time by any given individual.
This lack of information is exacerbated by the costliness of a mistaken choice, the high likelihood of the irreversibility of medical procedures and the high emotional involvement of the consumer. This can be exacerbated further by the potential for urgency issues (such as following a motor vehicle accident) and for patients to be incapable of making rational decisions (such as if they are unconscious or mentally impaired by their illness).
Unequal power is a result of patients lacking knowledge as described above, though expanded to include their rights in respect to the relevant health care system and their confidence and ability to articulate their legitimate grievances. Barr writes that it is implausible to imagine that this is the state of affairs for all consumers, though in the final analysis the issue is empirical (Barr, 2004).

The second concept is vertical equity - the redistribution of health care from rich to poor. This redistribution has become the norm in modern western economies. There are several reasons why such redistribution may be considered desirable. Firstly, the rich people may benefit directly from the altruism of helping others. Secondly, unhealthy people are likely to be less productive and may in fact foster further illness. In this case, providing health care to the poor may have a direct impact on the consumption level and general well-being of the rich. For example, more workers available will lead to lower wages which lowers costs for firms and thus lowers the price of goods consumed by the rich. Additionally, health care measures such as vaccinations are most effective when substantial portions of the population are treated. The rich gain direct health benefits from the vaccination of the poor and it may thus be in their best interest to provide such health care.


III - Arguments For and Against Government Intervention in Health Care

In markets facing externalities or other substantial failures, government intervention may be able to foster a more efficient outcome. Governments are also the principal mechanism for the redistribution of wealth for equity purposes.

Though many have argued for less government intervention in the health care sector, it is generally agreed that private health care markets suffer from significant failures as discussed above. Thus in most instances, the arguments for and against government intervention in health care markets are actually arguments about whether such intervention induces a more or less efficient outcome. For government intervention to be desirable on an efficiency basis the gains from an increase in efficiency must offset any deadweight loss incurred.

Governments face a myriad of options for intervention. These range from simple regulation, to public financing of private health care, to full public delivery in place of a private market. Simple regulations such as mandating minimum qualifications to become a doctor can help address some, but by no means all, of the incomplete information problems. Alternatively, governments can provide public financing of health care with or without public delivery.

In the case of public financing without delivery, health care services are provided by private firms. There are two general ways in which this financing could be structured. The first is through private finance for ‘easy’ cases in the form of regulated insurance markets, with state financing covering residual (i.e. largely uninsurable) conditions and for those unable to afford basic coverage. Regulations take the form of minimum standards of coverage and compulsory insurance for all citizens.
The second method is state finance. In this the state pays all medical bills, using either a social insurance system or tax revenue. As social insurance systems are not strictly actuarial, they avoid most of the gaps in coverage problems that arise in purely private markets. (Barr, 2004)

Alternatively, the government can both finance and provide health care. Such systems can overcome many of the failures inherent in private markets. Barr argues that public delivery systems such as the UK’s NHS can provide more efficient outcomes. He argues that doctors deciding treatment addresses the problems of consumer ignorance and that the system avoids many gaps in coverage by abandoning the insurance principle and providing tax-financed health care that is free at the point of use. The minimal use of fee for service arrangements limits the third party payment problem. Administrative rationing of health care provides a restriction to the quantity consumed, this helps prevent over-consumption of health care arising from the null cost to the consumer.

The issue of vertical equity is a normative one, that is to say it is values based and depends on the beliefs of individuals. Libertarians often support redistributions for the utility-boosting reasons described above, but believe that this should be on a voluntary basis rather than through enforced taxation. They often believe that the current level of redistribution is larger than the optimal level. Socialists support redistributions for their own sake, arguing that they increase equity and that the current level of redistribution is likely suboptimal.


IV - Role of the Public and Private Sectors in Australian Health Care

Australia’s health care system features a significant portion of both public and private involvement.
The federal, state and territory governments all play a role in the funding and delivery of health care. Medicare, the national health insurance scheme, is administered and funded by the Commonwealth Government. The state and territory governments administer the public hospital system, which is jointly funded by the state/territory and Commonwealth governments.
The private sector is composed of a mix of both not-for-profit and for-profit organisations and accounts for approximately one-third of health expenditure in Australia (Australian Bureau of Statistics, 2007). The private sector plays a strong role in the delivery of health care services, accounting for 55.8% of operating room use in 2004-05 (Australian Bureau of Statistics, 2007). 41.2% of hospitals in Australia are private, accounting for 32.4% of hospital beds (Australian Bureau of Statistics, 2007).


V - Differences between the Australian Approach to Financing and Delivery and the United Kingdom Approach

Within the United Kingdom the private sector plays a significantly smaller role than it does within Australia. Private insurance covers only 11% of the population as compared to approximately one-third within Australia (Ross et al, 1999). There are also fewer co-payments required in the United Kingdom, with payments required only for pharmaceuticals, eyesight tests and up to 80% of dental costs (Ross et al, 1999). Funding is overwhelmingly through general taxation.
Health care delivery within the United Kingdom is also predominantly provided by the government rather than the private sector. All hospital staff are salaried employees of the state, whilst general practitioners are self-employed individuals who contract their services to the state. Though similar conditions exists within Australia for general practitioners, hospital staff, especially doctors, within Australia undertake substantial quantities of private work, often within the hospital system. The Australian system also features a far greater proportion of fee-for-service arrangements than the United Kingdom system does.


VI - Differences between the Australian Approach to Financing and Delivery and the United States Approach

The United States health care system is substantially different from the Australian system. Financing within the United States is predominantly through private means, with 61% of the population in employment-related health cover, underwritten by tax concessions (Ross et al, 1999). The Federal Government finances free basic cover for the elderly and disabled, along with a safety net for the poor. However, there are no assurances of universal coverage and some 14% of the population is not covered by insurance or safety nets. This contrasts strongly with Australia which provides often free cover to all citizens and a number of non-means tested safety nets (alongside stronger safety nets for low income earners).
The majority of health care within the United States is provided by private, for-profit organisations (Ross et al, 1999). Again, this contrasts strongly with Australia where nearly two-thirds of hospital beds are within public hospitals (Australian Bureau of Statistics, 2007).


VII - Comparisons between the Australian, United Kingdom, and United States Health Care System Costs

Health care costs can vary quite significantly across countries. There are a number of ways to measure health care expenditure. Traditional methods include measuring the proportion of GDP spent on health care and comparing per capita PPP.
There are some potential difficulties in using the proportion of GDP as a measure of health care expenditure. In recessions when much of the economy is contracting, health care expenditure stays relatively constant (even more so in countries with a large public health sector). Thus the proportion of GDP spent on health care will rise in a recession and decrease in an expansion without underlying changes in actual health expenditure (Ross et al, 1999).
Per capita purchasing power parity avoids this difficulty. However, it does introduce problems concerning the use of a given basket of health care goods. This becomes particularly problematic when one considers that many basic health care goods differ substantially across nations. An example is the prevalent use of aspirin in the United States as compared with the use of paracetamol in Australia. Though direct costs of these two drugs are comparable, this may not be the case with preferred surgical procedures or powerful new drugs, especially chemotherapeutics. Furthermore, PPP is not adjustable for inflation and can thus not be compared across time (Ross et al, 1999)
Therefore, it is best to look at the data in conjunction with one another. That is, to compare both PPP and the proportion of GDP, along with other measures as available. Table 1 shows the expenditures in both PPP and the proportion of GDP for Australia, the United Kingdom, and the United States. It is quite evident that the United States spends far more per capita than either Australia or the United Kingdom. Indeed, it spends nearly twice the United Kingdom as a proportion of GDP and more than double in terms of PPP.

Table 1 – 2004 Health Expenditures in Australia, the UK, and the US
 GDP (2004)Per capita US$ PPP
Australia9.53128
United Kingdom8.12560
United States15.26037

All data are 2004 figures
Source: OECD, 2007


It can also be important to look at differences in public expenditure across countries. The most frequently used method is to describe public expenditure as a proportion of total health expenditure. In 2004, the United Kingdom’s public expenditure was 86.3% of total expenditure, nearly twice that of the United States’ 44.7% and one-third higher than Australia’s 67.5% (OECD, 2007). It is interesting to note that across these three nations there seems to be a negative association between total health care expenditure and public health expenditure. This is perhaps empirical evidence that a public health system is more adept at avoiding the problems that contribute to the over-consumption of health care than a private system is.


VIII - Comparisons between the Australian, United Kingdom, and United States Health Care System Outcomes

It is not sufficient to compare health care costs across nations. If higher costs are associated with superior health care outcomes system may be preferable to the low-cost, low-outcome system. As such it is important to consider the health outcomes across the three nations. Unfortunately, health is a difficult concept to precisely define and there are thus extreme difficulties in measuring outcomes. Commonly used health indicators include infant mortality and life expectancy at varying ages. There may be some discrepancies in these data caused by changes in health care. For example, there is some evidence that infant mortality can rise slightly in the presence of greater reproductive services. This is because the availability of fertility treatment to women who previously could not become pregnant results in a greater number of high risk pregnancies. There are also associations between greater health and general welfare and delaying the age of first pregnancy. As age of first pregnancy is a significant factor in the risk of pregnancy, this too can have a negative impact on infant mortality. However, it is likely that these impacts are relatively minor and, as such, infant mortality and life expectancy are the most widely used health indicators.
Table 2 shows three health indicators for Australia, the United Kingdom, and the United States. Australia has the best results for each of the health indicators. The United States’ infant mortality is significantly high – only two OECD nations had higher rates (Mexico 19.7 and Turkey 24.6) (OECD, 2007). It should be noted that all three nations have infant mortality rates that are higher than the OECD average.

It is interesting to note that the country with the more mixed public-private system produces the best results of the three countries examined. However, the data set is far too small to provide any conclusive results.

Table 2 – 2004 Health Indicators for Australia, the United Kingdom, and the United States
 Infant MortalityLife Expectancy at BirthLife Expectancy at Age 65
FemaleMale
Australia4.780.621.117.8
United Kingdom5.078.919.1*16.1*
United States6.877.820.017.1

All data are 2004 figures except * - 2002 data
Source: OECD, 2007

IX - Conclusion

Government intervention in health care provision is an important and difficult topic. The clear failure of private markets to efficiently allocate health care services, and the superior health indicators in countries with stronger public involvement in health care clearly indicate the desirability of government intervention. The precise method of intervention is a far more contentious issue and it is strongly debateable which precise mix of public and private financing and delivery is optimal. Indeed, it is likely that there are a range of optimal solutions, varying with preferences, circumstances, and other factors.


References

Australian Bureau of Statistics 2007, ‘Health care delivery and financing’, Year Book Australia, no. 89, Cat. No. 3010, pp. 277-294.

Barr, Nicholas 2004, ‘Health and health care’, Economics of the Welfare State, 4th edition, Oxford University Press, Oxford.

Besley, Timothy, and Gouveia, Miguel 1994, ‘Alternative Systems of health care and provision’, Economic Policy, vol. 9, no. 19, pp 199-258.

OECD 2007, OECD Health Data 2007 – Frequently Requested Data, http://www.oecd.org/dataoecd/46/36/38979632.xls Last accessed: 01/10/2007

Ross, Bill, Nixon, Jen, Snasdell-Taylor, Jamie, and Delaney, Keir 1999, ‘International approaches to funding health care’ Occasional Papers: Health Financing Series, no. 2, Commonwealth Department of Health and Aged Care.

Tuesday, 3 July 2007

Just How Valuable Is An Iceberg Lettuce?

I wanted to make a Chicken Caesar Salad for lunch today. Unfortunately, I put our (never actually) weekly shopping list together in a rush last Saturday and neglected to include cucumber and lettuce. Thus we had neither and I was lacking two essential ingredients for my salad.

One of my housemates was also contemplating our lack of ham (or any other sandwich meat for that matter) and I had reason to go to the bank in the early parts of this week and so it was that we set off. Our little plan was akin to a surgical snatch-and-grab style operation. Neither one of us really wanted to leave the house, but we both wanted our lettuce, ham, cucumber, and banking services just that little bit more than we wanted to stay home. It was with some annoyance then that our short little strike managed to turn into a lengthy adventure with no clear exit strategy.

We went to the Coles at Windsor Gardens. Now, normally I do all of my shopping at Woolworths. I preferred BiLo, but since Coles-Myer deemed BiLo a redundancy I no longer enjoy that option. Ironic then that I now shop nearly exclusively at Woolworths. Today though, we went to the Coles simply because it is next to the bank I needed to go to.

Would you believe that we could not find the iceberg lettuce? We looked everywhere. Three times. Confused as to our inability to locate something so basic, so essential that surely there isn’t a supermarket in the country which doesn’t stock it, we asked a not-quite-friendly storeman where we could find our beloved iceberg. Somewhat grumpily he pointed in the general direction of the fruit and veg section and gruffly said “that way”. I was expecting another round of pointless searching, but the man did actually wander over with us and was quite obviously startled at the distinct lack of anything resembling an iceberg lettuce. He said he would go and find out for us and disappeared through the doors to the staff areas. I suppose I can understand his cranky attitude. He was, admittedly, in the middle of restacking some shelves and it does seem an insane request, along the same lines as “Excuse me, I don’t quite seem to be able to find the cash registers…”

This gave my housemate and me sometime to stand around and look at all the produce that was available. We don’t tend to pay a lot of attention to the specific prices of various goods, we may be ‘poor students’ but we are actually reasonably comfortable and when it comes to food we basically just buy what we want. We have, however, noted the price of some items. For example the short-cut rindless bacon that we buy at least half a kilo of each week sells for about twelve dollars per kilogram at our local Woolies. Capsicum has tended to sell for $3.98 or $4.98/Kg for the traditional colours and nearly double that for the crazy orange and yellow varieties.

And so the $6.98/Kg price tag for red capsicum at Coles Windsor Gardens grabbed my attention and, in fact, convinced me not to purchase any capsicum today. A quick look around the store revealed several other items that were priced at least a little higher than they are at our regular Woolworths. Interestingly the green capsicums were on sale and selling for a mere $3.98/Kg (damn our house’s preference for red capsicums).

The man came back and told us that the lettuce delivery that day had been sent back due to the unsatisfactory quality of the iceberg lettuces and thus there would be none today. I was disappointed, but I both accept and applaud the store’s decision. I would have been far more unhappy and disapproving of low quality, inedible lettuce than I am of their lack of lettuce. So we looked at the other varieties of lettuce and purchased some oak lettuce instead.

That turned out to be a mistake. We tried the oak in the car. I couldn’t quite decide if it tasted more like leaves off a bush that I had in my front yard when I was ten or grass. It is perhaps best not to question what I ate when I was ten. This lettuce, however, was chewy and largely flavourless. It was nothing like the crisp, watery iceberg that I had been looking for.

So, it was decided that we would go to another store and try our luck again. Around the corner, on the path home, is another Coles, specifically Coles Greenacres. I was interested to discover that the green capsicum was on sale at a different price here. A mere $2.99/Kg, nearly a full dollar cheaper for a three minute drive.

They did in fact have iceberg lettuce at this store. It was tiny. Barely larger than my two fists and for its size it seemed exorbitantly priced at $3.47 each. Even less appealingly it was various shades of brown. It looked edible though not long for this world and not nearly as nice as I would normally like. In retrospect it seems silly that I would have tried another Coles, after all they likely get their lettuce from the same place. But, my desire for lettuce was strong and I was even more determined to thwart the universe’s seeming desire to leave me without lettuce. So I grabbed the least unappealing one and headed to the checkouts.

There were lines. Long lines. At all of the open checkouts. My housemate and I stood in a line and discussed, you could say complained (albeit jovially), about the price of lettuce and the fact that a store had actually failed to have any in stock. As I looked around I remembered the green grocer across the walkway. I assumed they were likely to have cheaper and better lettuce than we currently held. So we returned our lettuce to its pile of brown runts and looked for a way out of the store. The options seemed to all involved pushing past someone, be it a little old lady, a fat smelly man, or a scary-looking tattooed guy with a grim expression. So we found some railings to jump and walked across the hallway.

Indeed the greengrocer did have iceberg lettuces. They took us all of five seconds to find. Better yet we were presented with options – we could get our lettuce inside a ‘stay-crisp’ bag or rolling around free. Even better was that the lettuce was cheaper at the green grocer ($2.99 without the ‘stay-crisp’ bag, $3.25 with the bag). The best part was that the lettuces were a decent size, easily more than the twice the size of their inferior cousins across the walkway. They even managed to avoid having brown leaves and stems. We bought a nice-looking lettuce of good size that wasn’t inside a ‘stay-crisp’ bag.

I imagine that by this point you are asking yourself why I have been harping on about this lettuce. It could be that I want to disparage Coles and their ineptitude at ensuring the supply of a non-defective basic good or it could be that I want to expose the blatant profiteering in their price-setting from store to store.

In truth, I have no particular interest in either of these things (today at least). I’ve gone grocery shopping somewhere in the vicinity of one to two thousand times over the last ten or so years. I have no idea how many times I have been to Coles, but I imagine that it at least tops one hundred (Woolworths would be at least twice that, and BiLo many times that). This is the first time I have ever encountered any major supermarket not having such a basic commodity when I wanted it. Their produce may not always be of the quality I want and they have often times not had the seasonal fruit that I had a hankering for (though I suspect this has something to do with my complete lack of knowledge as to fruit seasons and my desire for high quality fruit to be in store whenever I happen to want it). However, they have always had apples, iceberg lettuce, and milk. So, I am happy to give them the benefit of the doubt and assume that I was merely an unlucky individual who got caught out in a one in a million event.

I see even less reason to attack their profiteering. Price-variations can be due to a myriad of events and it is not entirely unreasonable to give some benefit of the doubt to the various Coles stores. Perhaps the Greenacres store mistakenly over-ordered the green capsicums and so chose to set the price lower, or perhaps there has been even less demand for green capsicums at Greenacres in the past few days. Even if it is simple profiteering, Coles is a competitive retailer, on the average and in the long-run I have little doubt that their prices are roughly equal to those of other chains. Any over-all trend is likely to be due to differences in rental costs and other overheads and is likely to be corrected by the market if they are large enough to be noticeable to the average consumer. Furthermore, if I wanted to, if it was worth it to me, I could quite easily go to the multiple stores and determine how I could best construct my shopping list so as to get the cheapest possible basket of goods. I choose to pay the premium on the occasional good to get what I want, when I want it, where I want it. So, I have no actual complaints about their pricing structure. (Tim Harford provides a well-written explanation and discussion of this practice for the layperson, alongside a series of explanations that practically amounts to an Economics 101 course, in his book The Undercover Economist (official site, amazon.co.uk)).

No, my reason for telling this story is to ask a question. Would you have done much the same thing to get the lettuce for the salad you just had to have?

I suspect the answer is, if people actually look at their past activities, likely to be a ‘yes’ far more often than it is a ‘no’. To get my lettuce I spent about an hour and seven dollars. That doesn’t take into account my petrol, wear-and-tear on the car, the other driving-caused externalities (emissions, wear-and-tear to the road, congestion), the increased wear-and-tear on my clothing from being exposed to the weather, the displeasure at getting rained on, or the time and effort that my housemate also expended. How much does all that come to? How much did I actually spend on the lettuce?

Well, let’s start with the cost of the lettuce itself: $2.99, or rather $3. How do we count the oak lettuce that I bought? I never would have purchased it if the initial Coles had had the iceberg that I so wanted. I’m also unlikely to actually use that lettuce now that I have iceberg (and now that I’ve tasted the oak). So, there is an argument to be made for including that in the cost of the lettuce. Except that to make that argument would be to violate one of the fundamental principles of economics – to ignore sunk costs. So, we do not count the cost of the oak lettuce at all (at least in so far as working out if I should have gone to such effort to get an iceberg lettuce). I will look more at why we ignore sunk costs after the remainder of the cost breakdown.

The next range of costs looks at my travel and time expenses. The tricky part here is that I did not go to the store just to get lettuce. I also needed to go to the bank and I needed to get cucumber. To complicate matters further, my housemate accompanied me – she wanted to get lettuce and ham.

Travel costs need to take into account all the costs that I bear of travelling to and from the store. I will deal with the time I spent separately. I travelled for three goods – banking services, lettuce, and cucumber. The amount of extra non-time travel related expenses for driving to the second store were miniscule, so I shall ignore them (it would have been no more than an extra 50m of driving). Since I was equally interested in all three goods, it seems reasonable at face value to suggest that the lettuce was responsible for one-third of the travelling. I travelled about 6Km each way to the Windsor Gardens store, so my total travelling was about 12Km. So at first it seems reasonable to say the lettuce was worth 4Km of travelling. However, if I had not wanted the banking services I could have travelled to my local Woolworths, which as a return-trip would have been a mere 4Km. So, I shall split the 4Km between the cucumber and lettuce, and leave the remainder to the banking services. So, the lettuce was worth 2Km of travelling.

My car gets about 6L to the 100Km, and once you do the calculations this implies that I used about 0.12L to get the lettuce, which given I last bought petrol at 130.9c/L means I spent not quite 16c on petrol for this journey. Hardly a significant amount and far less than I had anticipated, else I very likely may not have bothered to include this amount.

I will ignore the fact that my housemate accompanied me for this part for two reasons. Firstly, I would have gone regardless of whether or not she had and secondly, despite her accompanying me, I still bore the full cost of the travelling – she did not pay me any petrol money or anything else like that. Thus she did not actually change the travel-related costs that I faced.

For the sake of simplicity I will also ignore the other costs associated with the journey. The annual car registration, the initial purchase of the car, and the comprehensive insurance which protects it are all up-front costs and as such have no marginal cost – that is, they did not cost me anything for this journey. I will still have paid those costs regardless of whether or not I made this trip. The maintenance of the vehicle would be a miniscule cost (~$200 per 10,000Km) and the externality costs are not actually borne by me. Whilst I would like to claim to be a conscientious citizen if I am to be realistic then I must admit that the carbon emissions (and other pollutants), the congestion, and the increase in risk of a vehicular accident caused by another driver on the road did not factor in to any part of my decision making process.

What did factor quite strongly into my decision was the fact that it would take time and there were potentially better ways I could spend my time. The whole trip took an hour. A part of that was due to the banking services I desired – about ten minutes in total was extra driving time, and another five minutes in the bank. So, the proportion of the trip that was due to my desire to have lettuce and cucumber was about forty-five minutes. The tricky part here is that my housemate who accompanied me was only interested in lettuce and ham, the entire length of the trip was devoted to those two goods for her.

I will deal with the time I spent first. As discussed above, for me only forty-five minutes of the trip was due to the lettuce and the cucumber. Of those forty-five minutes, ten minutes was travel time, five minutes was spent getting the cucumber (which I walked past and would have completely forgotten about if my housemate had not reminded me. Much thanks to her.) and helping my housemate get her ham, and five minutes was spent in the check-out at the first Coles. That leaves twenty-five minutes that was just me trying to find lettuce. A further seven and a half minutes is added to the lettuce time from travelling and the check-out at the first Coles. That means I spent a total of 32½ minutes getting lettuce this morning.

My housemate had no need to travel further for the banking services and so the entirety of her travel time is split between lettuce and ham. Using the same breakdown I did above (but replacing cucumber with ham), leaves her having spent 42½ minutes buying lettuce.

This brings us to the difficult question of what our time was worth. To simplify things I will assume that 42½ minutes of my housemates time and 32½ minutes of my time are worth the same amount (an assumption that could quite possibly get me into more than a little bit of trouble…) So, how do I assign a dollar value to this time. If I was at work I would want no less than $15 for that half-hour. If a random person wanted to pay me to run around for that half-hour like I did, I would have asked for $20. However, neither of these figures are satisfactory. Had I chosen not to go and instead stayed home, I probably would have been doing a task that $10 or even a mere $5 would stop me from doing (notably watching an episode of The West Wing or reading the latest book I’ve purchased). How can one decide which figure to use? In the classes I have taken we would look at what else could have been done with the time, and what value that use of the time carried – helpfully, there would have been only one other option as to what could be done. Real-life, unfortunately, is not as helpfully clean-cut as a classroom model and there were about ten things I had been considering doing this morning, and so this process is probably not quite as useful and not nearly as simple or straightforward. For a start, some of those options – such as writing a blog post on Premier Rann’s new bikie laws, or reading the rest of my book – are difficult to value.

Ultimately it is probably impossible to pinpoint the precise dollar-value of that particular period of my time. However, since we are talking (mostly) about what I wanted and how I valued that time, I would put a price on it of $12.50. Now, that may not correlate well to my housemates view, but for this exercise it will have to suffice.

That brings the total cost of the lettuce to $28.16 plus a few fractions of cents and some (likely less insignificant) externalities. Of which I bore $15.66 and my housemate paid $12.50

Let me get this straight. We were willing to give over nearly thirty dollars of value for one lousy lettuce?

At no point did we seem to be acting in an irrational manner. At several stages along the adventure we asked one another if this effort was actually worth it. Each time we came to the conclusion that it was in fact worth the next piece of effort.

How does this happen? Why does this happen?

Well, it’s a fairly simple process actually. Rational people – and there is no reason to assume that we did not act like rational people for these purposes – ignore sunk costs and make their decisions at the margin. That is, they will ignore costs that have been paid in the past, and are irretrievable, as largely irrelevant to the current decision and they will make their decision based on the benefit from and the cost of the next unit purchased rather than on a basis of the average benefit or cost.

If someone had come to my door and offered me the lettuce for $15, I would have said no. I probably would have laughed in their face. It is a preposterous amount of money to spend on a lettuce. If they had come to me and asked me to spend a half hour chatting with a friend and walking around for the lettuce, I also probably would have said no. Though, it is arguable that that would be an irrational decision on my behalf. In fact it is far more likely that I would have taken the deal even if I didn’t want the lettuce – if only because I like talking to my friends and am more than willing to do so ad nauseam. Gods-only know why someone would offer you a lettuce. Which leaves us asking, why was I willing to do so when the costs came in small increments?

Firstly, we need to consider the premise that a rational decision will ignore sunk costs. Sunk costs are those costs which have already been spent and cannot be retrieved. So, the cost of driving to the first Coles was a sunk cost when it came to driving to the second Coles. I was willing to spend the five minutes it would take to stop at the second Coles on the way home and pick up a lettuce. That five minutes, taken by itself, was a low enough cost that I was quite happy to still get the lettuce.

Why does it make sense to ignore sunk costs? Consider this: The cost of a replacement item is $3, and you get $5 value from it. If you spend the $3, you have effectively made yourself two dollars better off. How is that affected by the previous decision? The simple answer is that it is not.

There is a more complex way of looking at this that most first year text books and courses seem to ignore. They are right in that the sunk cost in and of itself should be ignored. However, they hold the rest of the conditions constant. That is they assume that the real-cost to you for the first good is the same as the real-cost to you of the second good. This is true, or so close to true as to make no discernible difference, when the good is a tiny part of your overall budget. It is not true if the good is a massive part of your budget. Consider the following example: You only have $20 and there are only two goods you can spend that $20 on – apples and movies. Each apple costs $2 and each movie ticket costs $10. Since you would die if you did not eat at all, the first apple is worth a lot to you, say $1000. The second apple isn’t worth as much, whilst one apple isn’t enough to relieve your hunger it is enough to prevent your death (kids see a doctor and get your parent’s permission before testing that theory), so the second apple is only worth $500 to you. Similar reasoning sees the apples decrease in value. The third is worth $200, the fourth $100, the fifth $50, the sixth $40, the seventh $30, the eighth $20, the ninth $10, and the tenth $5. The first movie you see is worth $160 to you, but after that you are bored of sitting still and the second movie is only worth $100.

So you take your $20 and you think about how to spend it. You have three options for bundles that you can buy. You could buy no movie tickets, one movie ticket, or two movie tickets. If you buy no movie tickets, you will buy 10 apples. This gives you $1955 worth of value. If you buy one movie ticket, you will buy 5 apples and get $2010 worth of value. If you buy two movie tickets, you get no apples and only $260 worth of value. Clearly the best option is to buy one movie ticket and five apples. It will give you the most value for your budget.

If you were to lose six dollars on the way to the supermarket and cinema (and this is effectively what a sunk cost is – lost money, a lost ticket, or wasted time) then you would have only $14 and suddenly your options would change to one ticket and two apples, or no ticket and seven apples. The seven apples are worth $1920, whilst the movie ticket and two apples are only worth $1660. Suddenly the sunk costs are indirectly taken into account.

It is the change in your wealth rather than the sunk costs which may affect your utility function. It doesn’t matter if these wealth changes are because you lost a lettuce or because you bought some silverside.

Admittedly, this is not actually relevant to today’s adventure, the sunk costs did not affect my wealth sufficiently to have any discernible effect on my desire to have that damned iceberg lettuce.

Secondly, we need to consider how today’s adventure was structured. If the costs had been presented up front, they would have been far greater than the value of the lettuce and I would have never been willing to pay them. However, having already spent those costs there was no reason not to spend the next few dollars to get value from the lettuce that was worth more to me than those few dollars. I would still be better off than I was.

And so, by encountering the costs in small increments, where previous costs are irrecoverable we can end up paying nearly $30 for a single iceberg lettuce.


Daniel O'Brien.


Note One: Much of the above cost can actually be offset by viewing the value in the adventure itself. Firstly, it gave me something to blog about (blogging being an activity I derive pleasure from). Secondly, it was a source of amusement for me and my housemate at the time. Thirdly, the time was spent with my housemate which was enjoyable in and of itself. Fourthly, it allowed me to put some of the economics I have learnt in the classroom into action in my life, thus furthering my understanding (and passion) for the field. Is it possible that all of these benefits, once added in to the mix actually meant that I came out better today than the time, effort, and money cost me?

Note Two: Entertainingly. I forgot to put the cucumber in my salad. I didn’t realise that I had forgotten until I sat down in front of the television to watch an episode or two of The West Wing. At which point the opportunity cost of getting up from my comfortable seat was higher than the value I would derive from the cucumber. So I went without the cucumber. It would seem that the universe does actually win in the end.